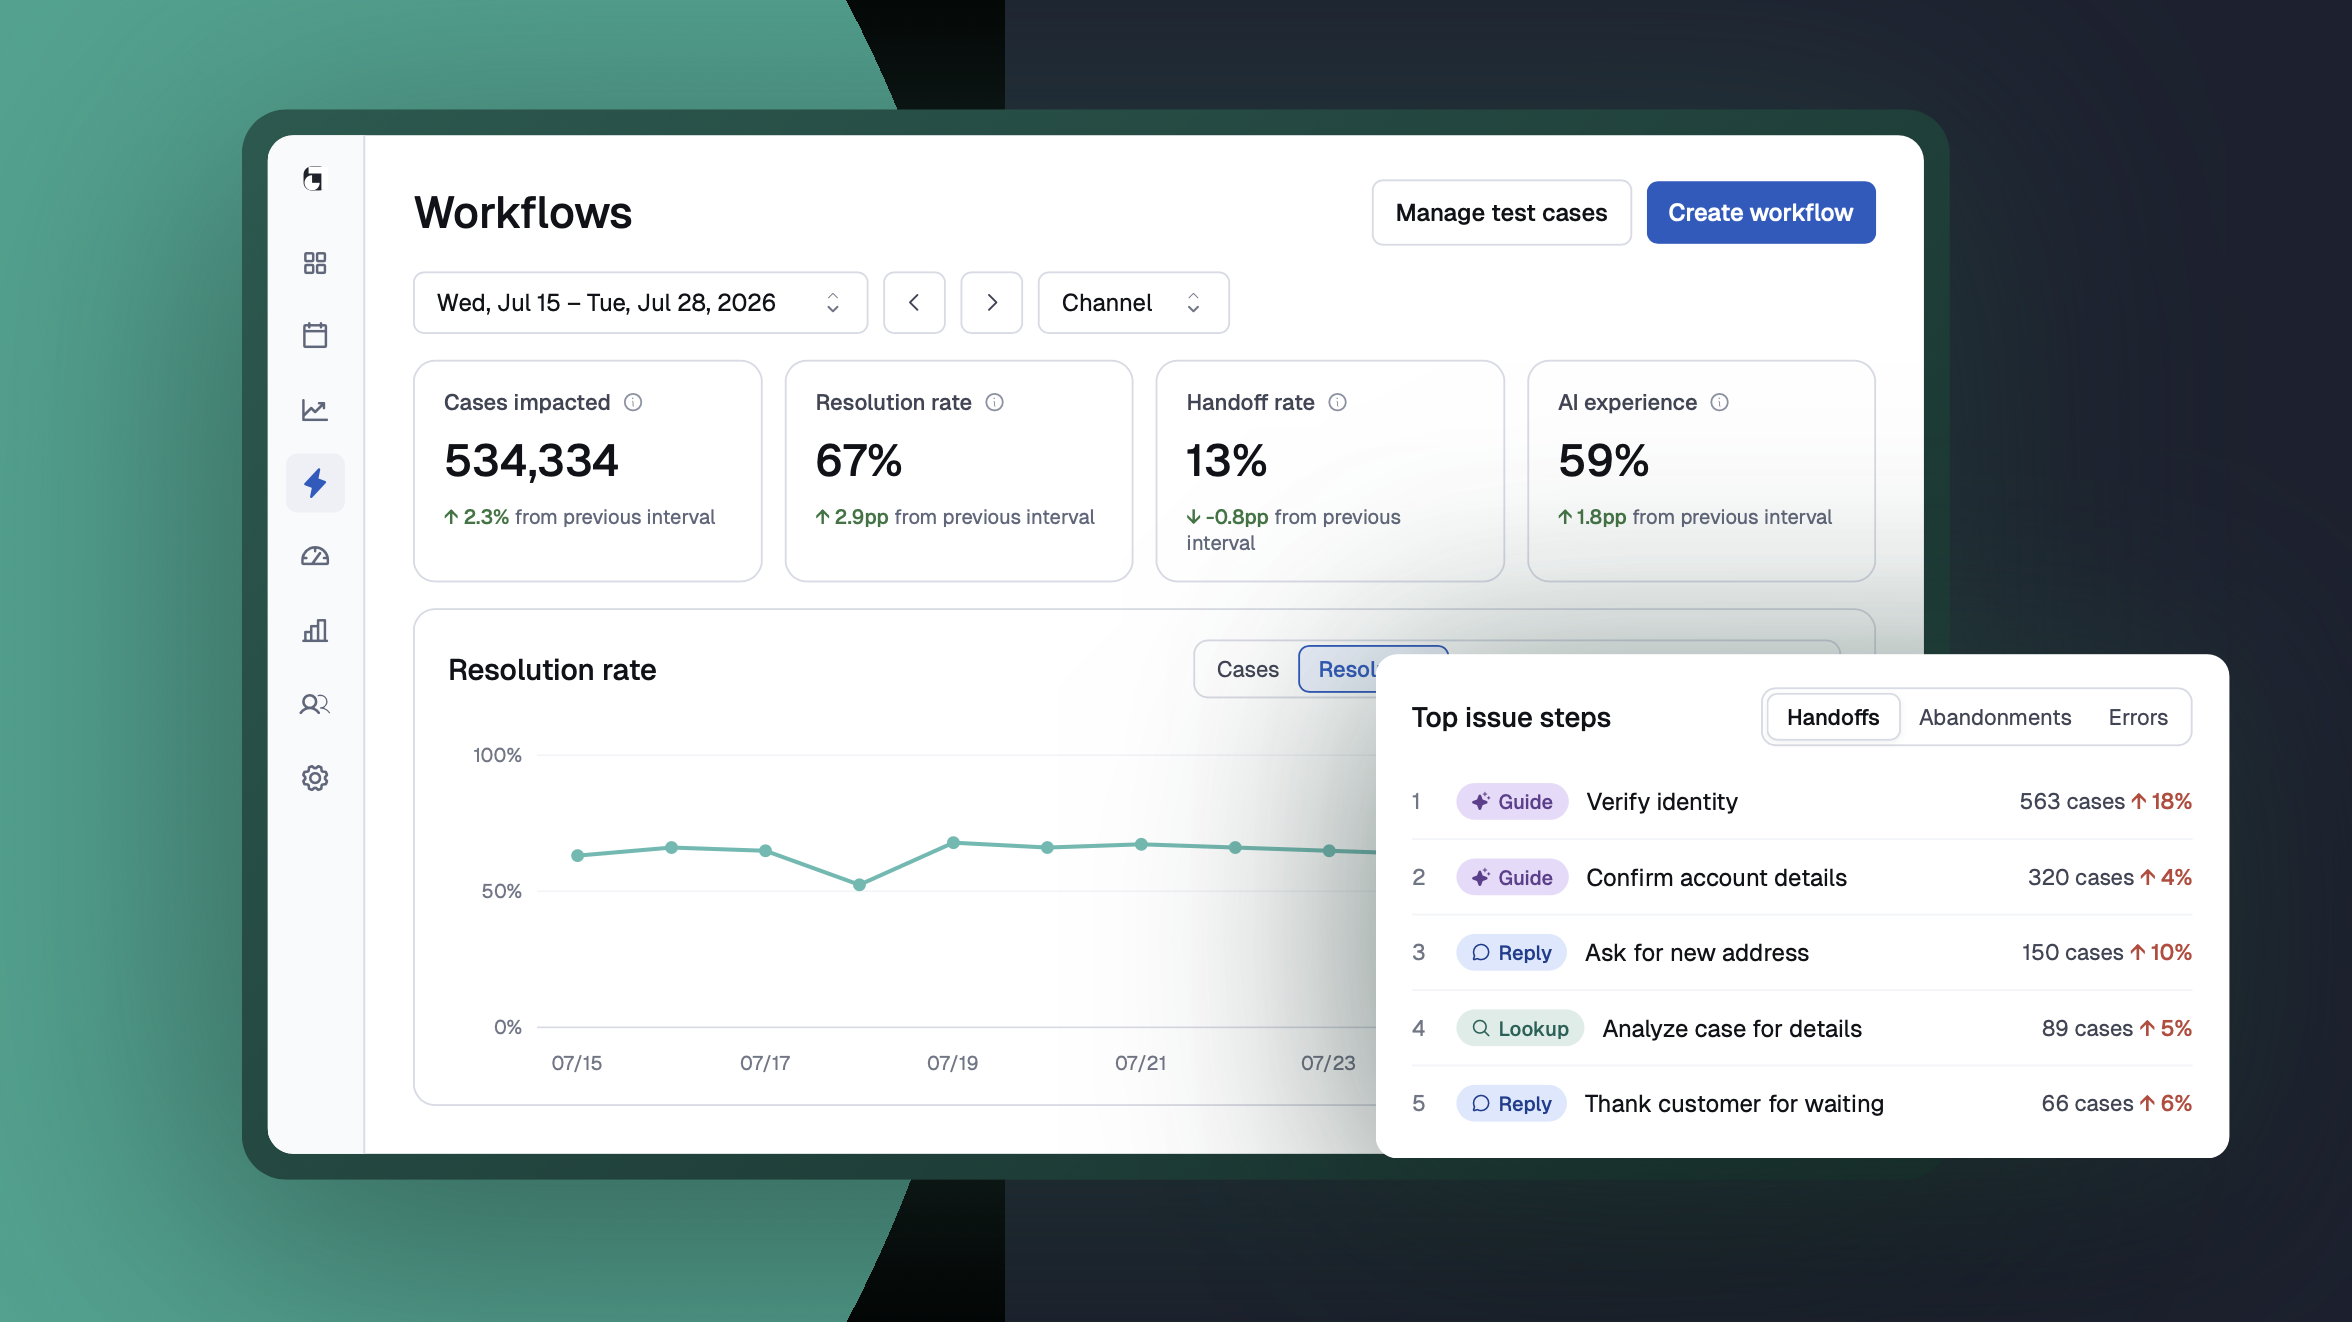
Today we're introducing a redesigned workflow monitoring experience in Assembled: a new Workflows page that shows how every workflow is performing at a glance, plus deeper per-workflow monitoring that pinpoints the exact step causing problems.

Your entire workflow operation, at a glance
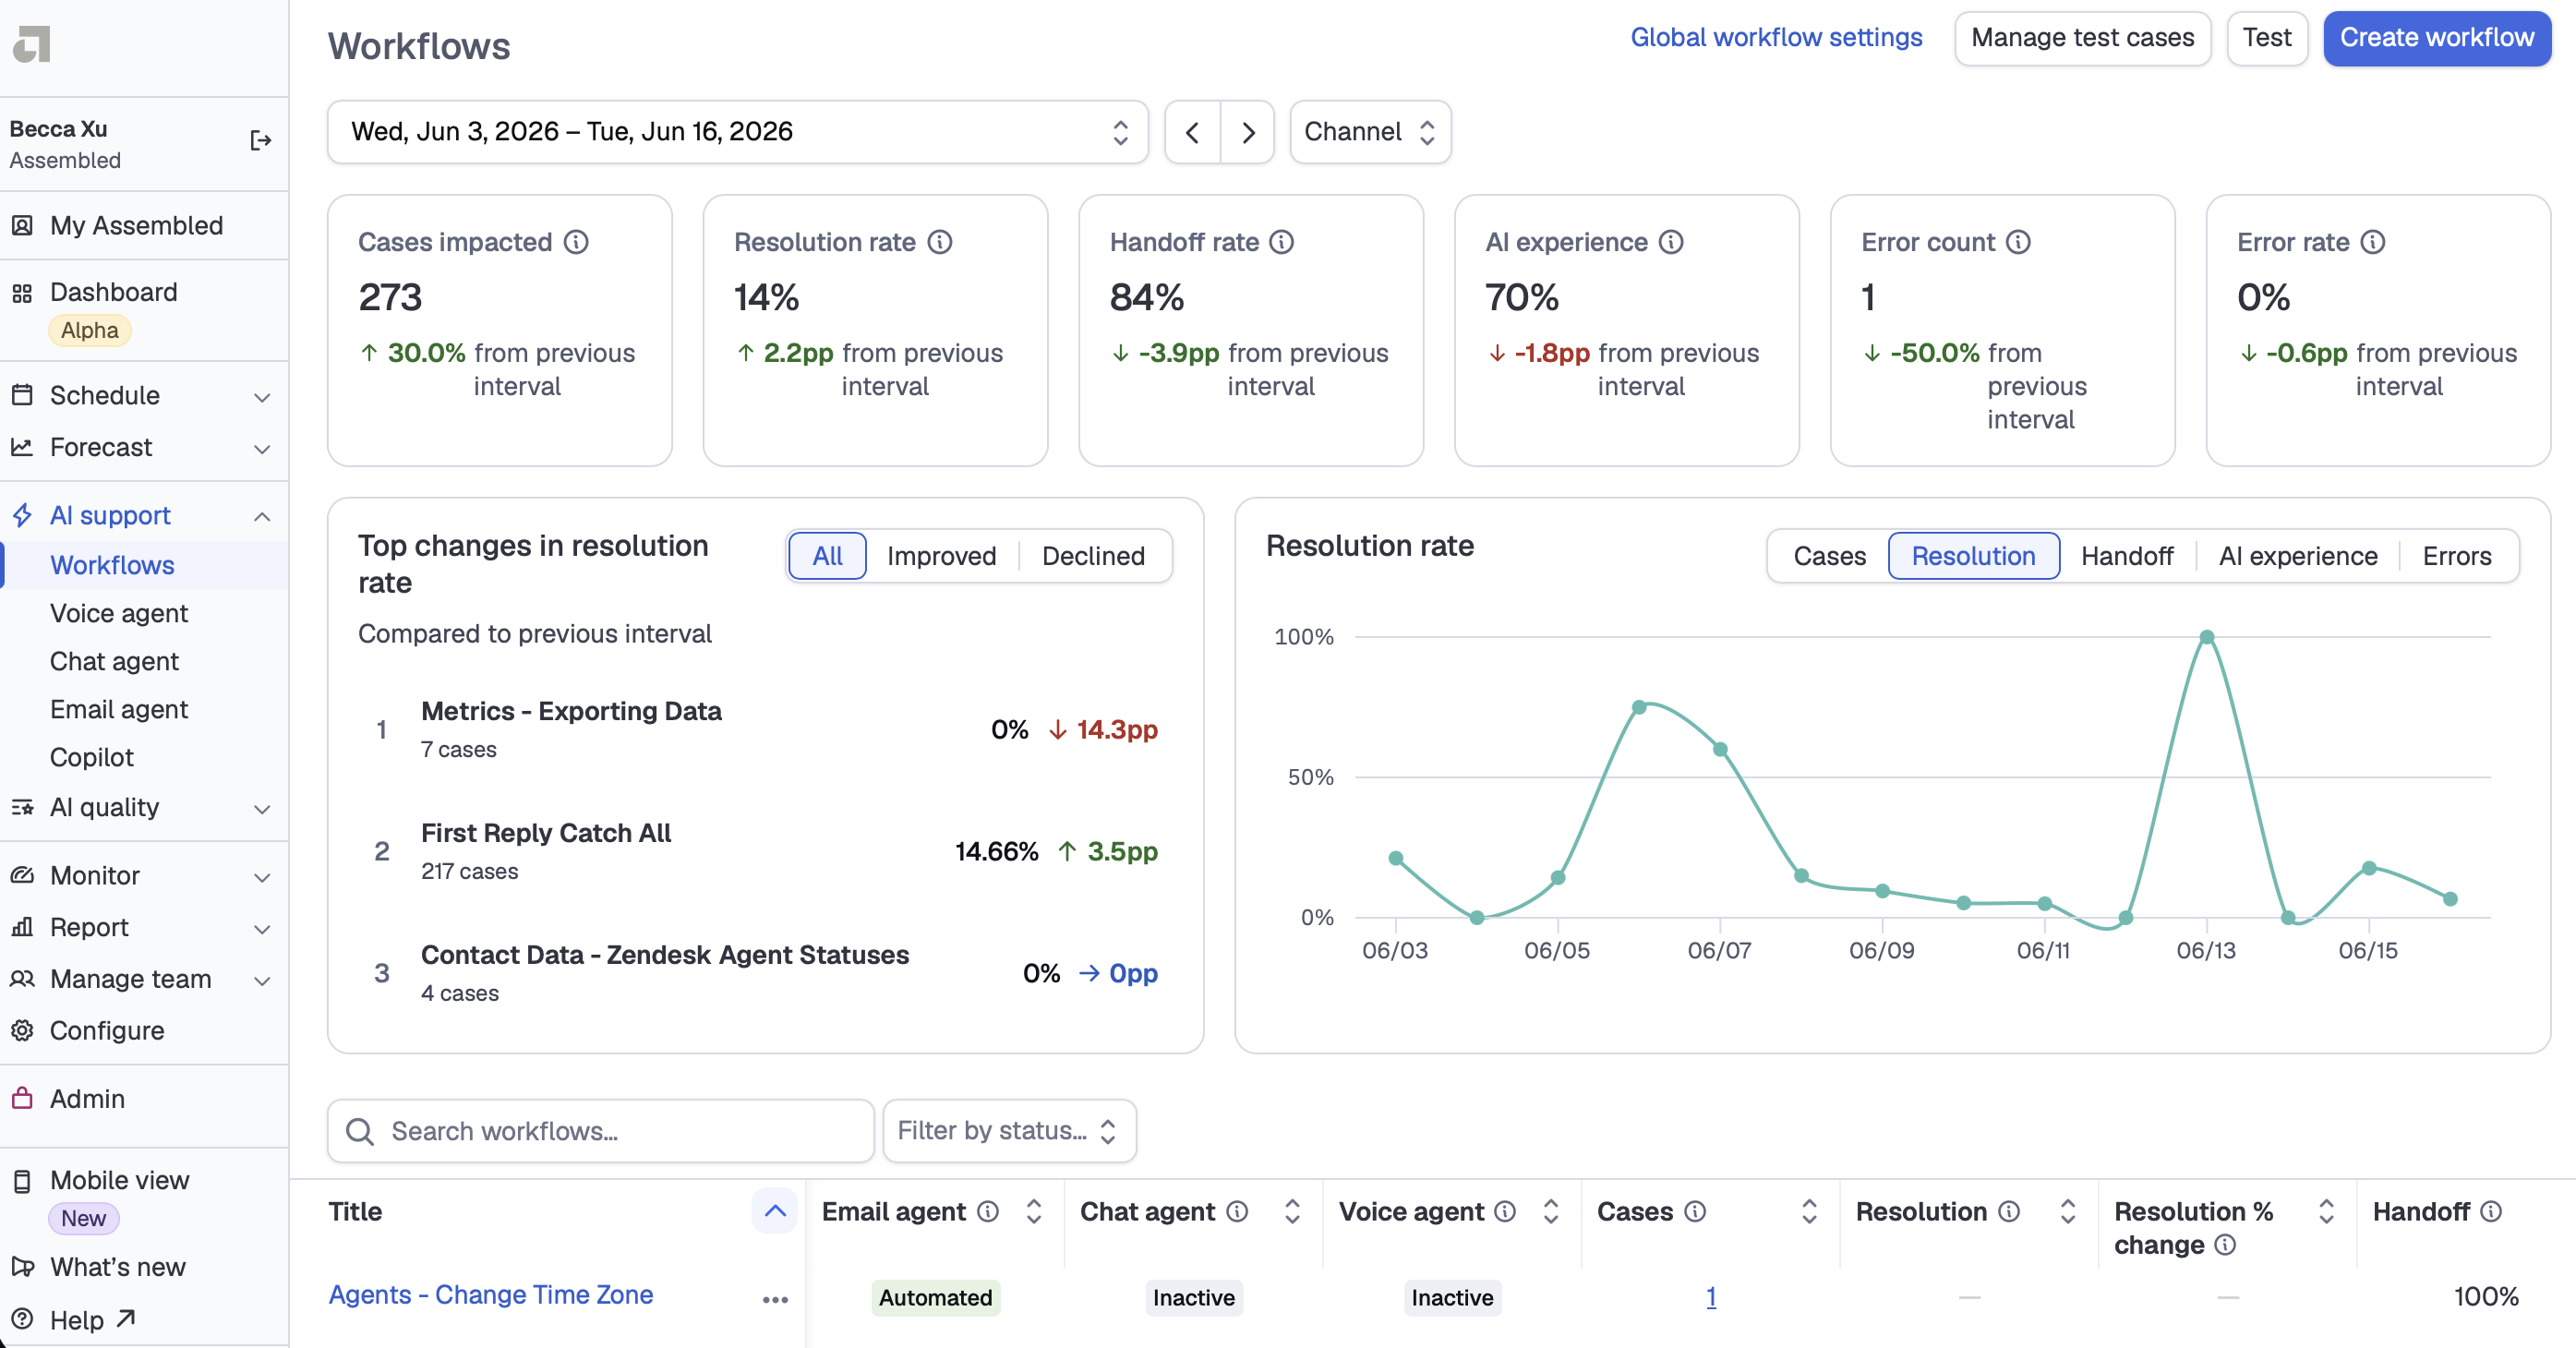
The new Workflows page opens with performance cards for your selected date range: cases impacted, resolution rate, handoff rate, AI experience, error count, and error rate. Each card shows the change from the previous interval. Filter by channel or other criteria to focus on what matters.
Know which workflows to look at first
The Top changes in resolution rate card lists the workflows with the biggest swings, improved or declined, along with their case counts, so you start your day with a prioritized list instead of a scavenger hunt. Below it, the All workflows table shows every workflow's metrics side by side. Search, sort, filter by activation status, and choose which columns you see.
Drill down to the exact step causing trouble
Inside each workflow, the Monitor tab's Top issue steps view ranks the steps driving the most handoffs, abandonments, and errors. Click a step to see the actual cases where it caused an issue, then jump straight to it with View step in builder to make the fix. And the Top data tools view surfaces data-connection steps, custom API calls, MCP steps, database connectors, ranked by error volume. That tells you when the problem is a flaky integration, not your workflow logic.
.png)
Get started
The new workflow monitoring experience is available now. Not yet using Assembled? Request a demo to see what it looks like to run AI workflows you can actually observe and fix.