Keeping an entire support organization on top of their SLAs is a monstrous task. Rising customer expectations means that team leads need to be able to get to the bottom of any issues as quickly as possible. With agents spread out among all different support channels and across timezones, staying on top of individual performance can be time-consuming, tedious, and overly complicated.
That is, until today, with the launch of our brand new ✨Agent Scorecard Report✨. To all the support teams who need to get down to the details of agent performance, this one’s for you.
Measure what matters most
So, you’ve got ticket volume accurately forecasted, and the right number of agents scheduled, but you still see SLAs slipping and teams out of adherence. What gives? Time to dive into your agent data.
Previously, there wasn’t an easy way to get a clear view into agent productivity. Team leads needed to flip back and forth between the Team Performance and the Agent Activity reports to get visibility into the channels their agents were on and their levels of adherence. Not only was this unnecessarily tedious, but it also lacked a critical input: quality assurance (QA).
Today’s launch, thanks to Agent Scorecard, brings the best of both worlds into one view, and then ups the ante by incorporating QA data, thanks to an important new integration with MaestroQA.
Other workforce management tools we used in the past were lacking agent visibility into metrics, but you guys have certainly solved that.
Clifton Farr
Workforce Operations Manager, TaskRabbit
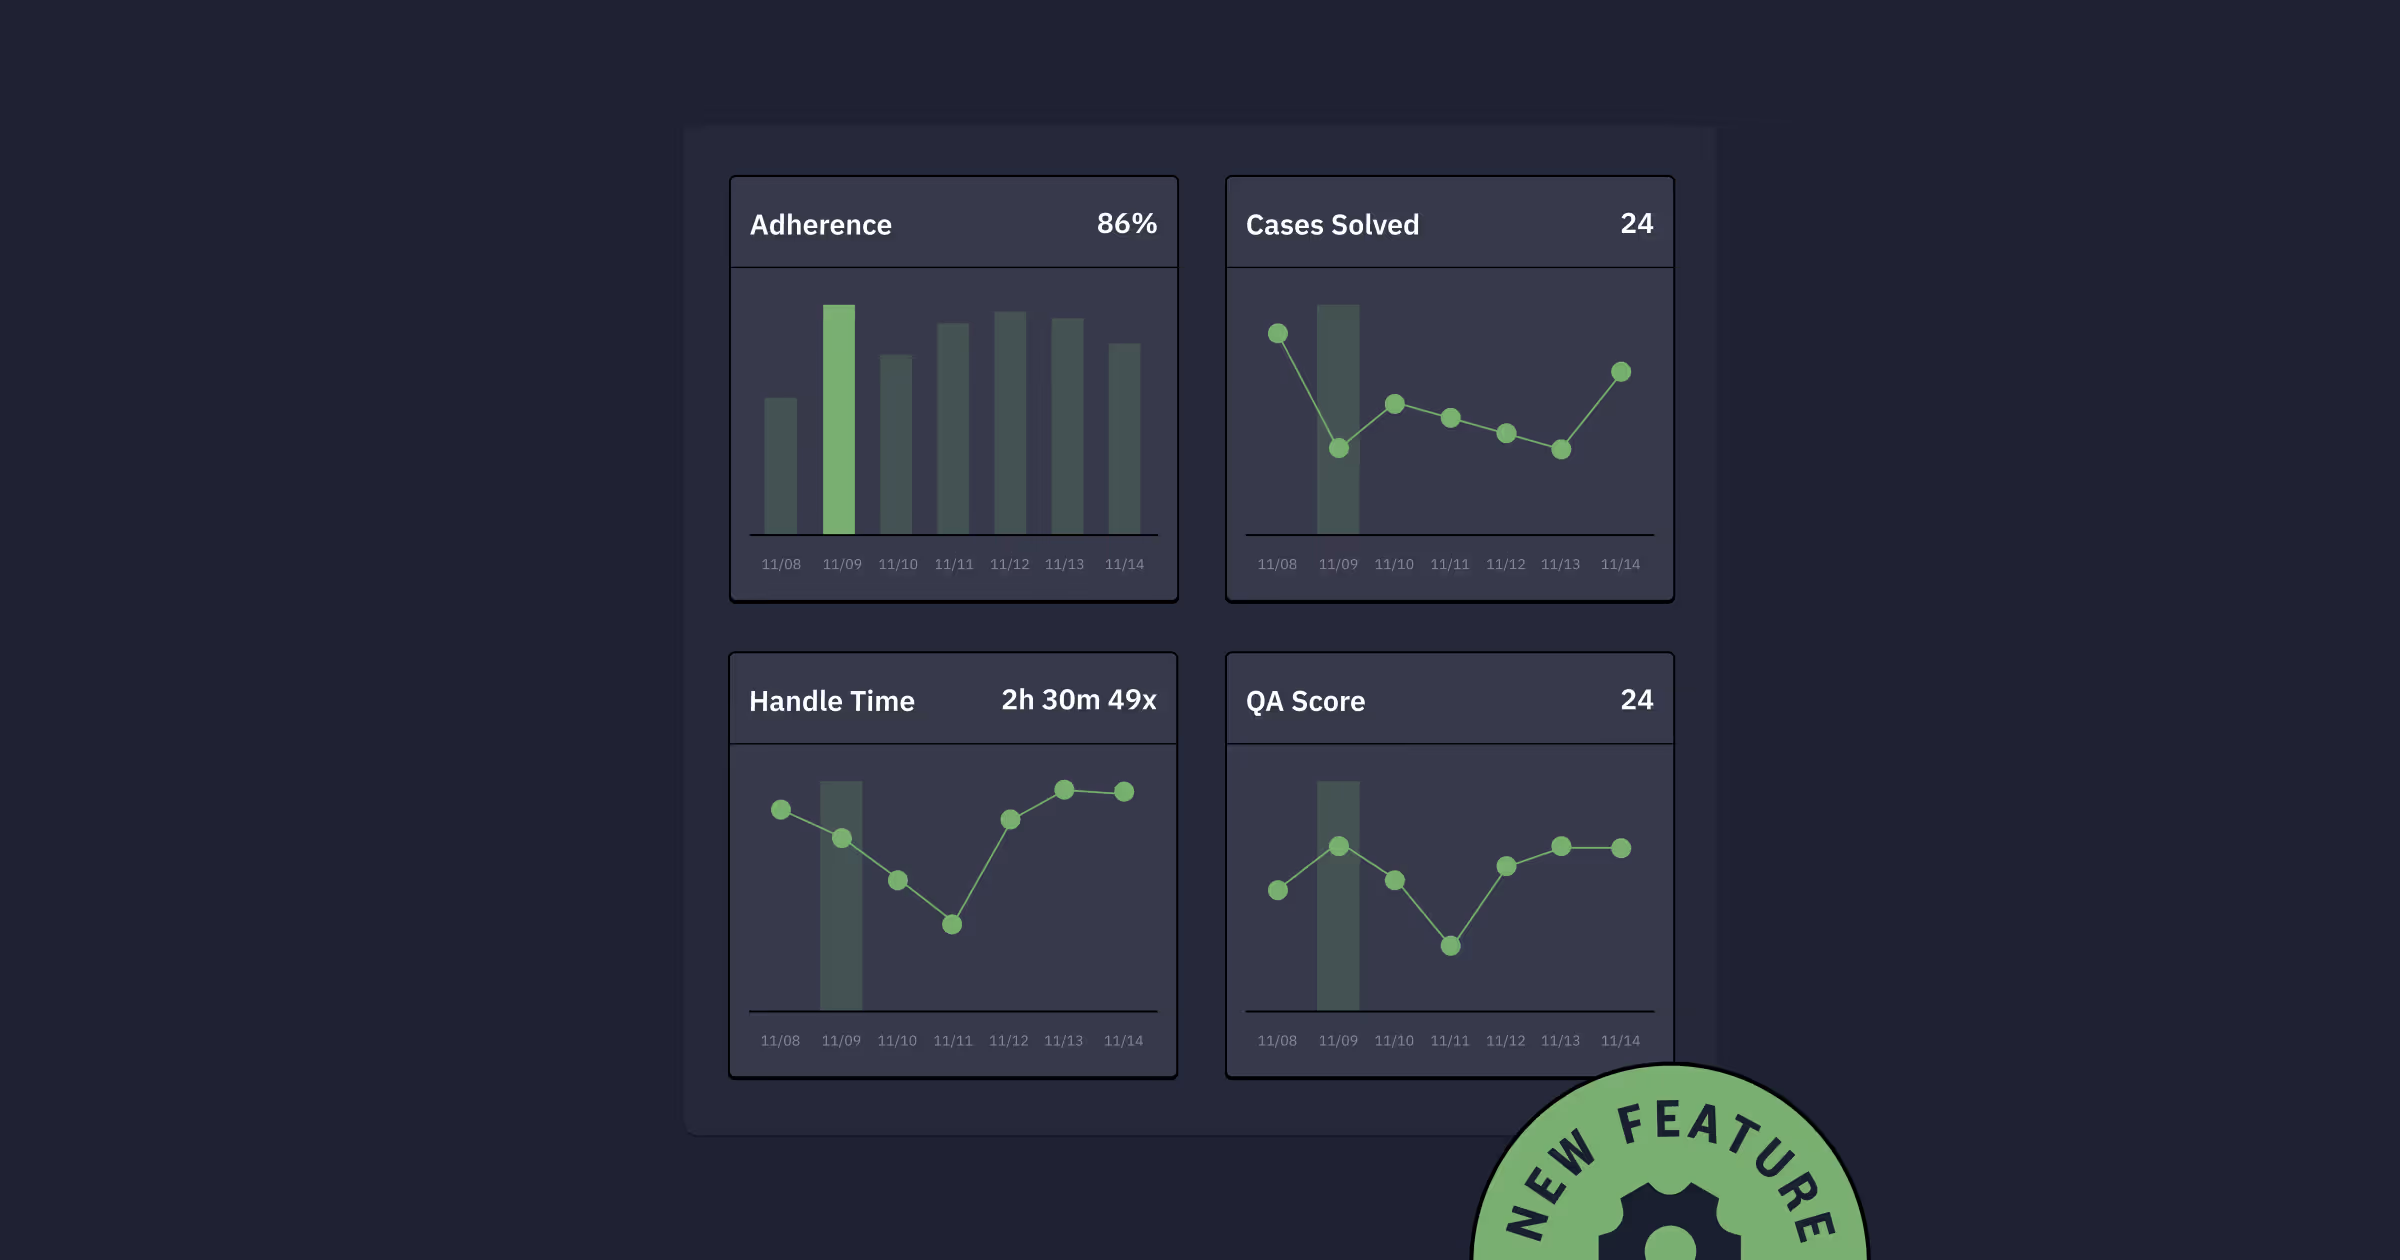
Here’s everything you’ll see in today’s launch:
- Average adherence percentage to get a quick overview of when the agent was adhering to their assigned schedule.
- Number of cases solved by the agent for your chosen timeframe, with hover data about day-over-day or week-over-week changes.
- Average handle time for phone, chat, and social support, to track how long it takes your agent to solve a case.
- Email utilization percentage to track how often an agent was productive or available to handle incoming cases on their assigned channel.
- Quality assurance score, via our MaestroQA integration, to measure how closely agents meet your team’s defined expectations.
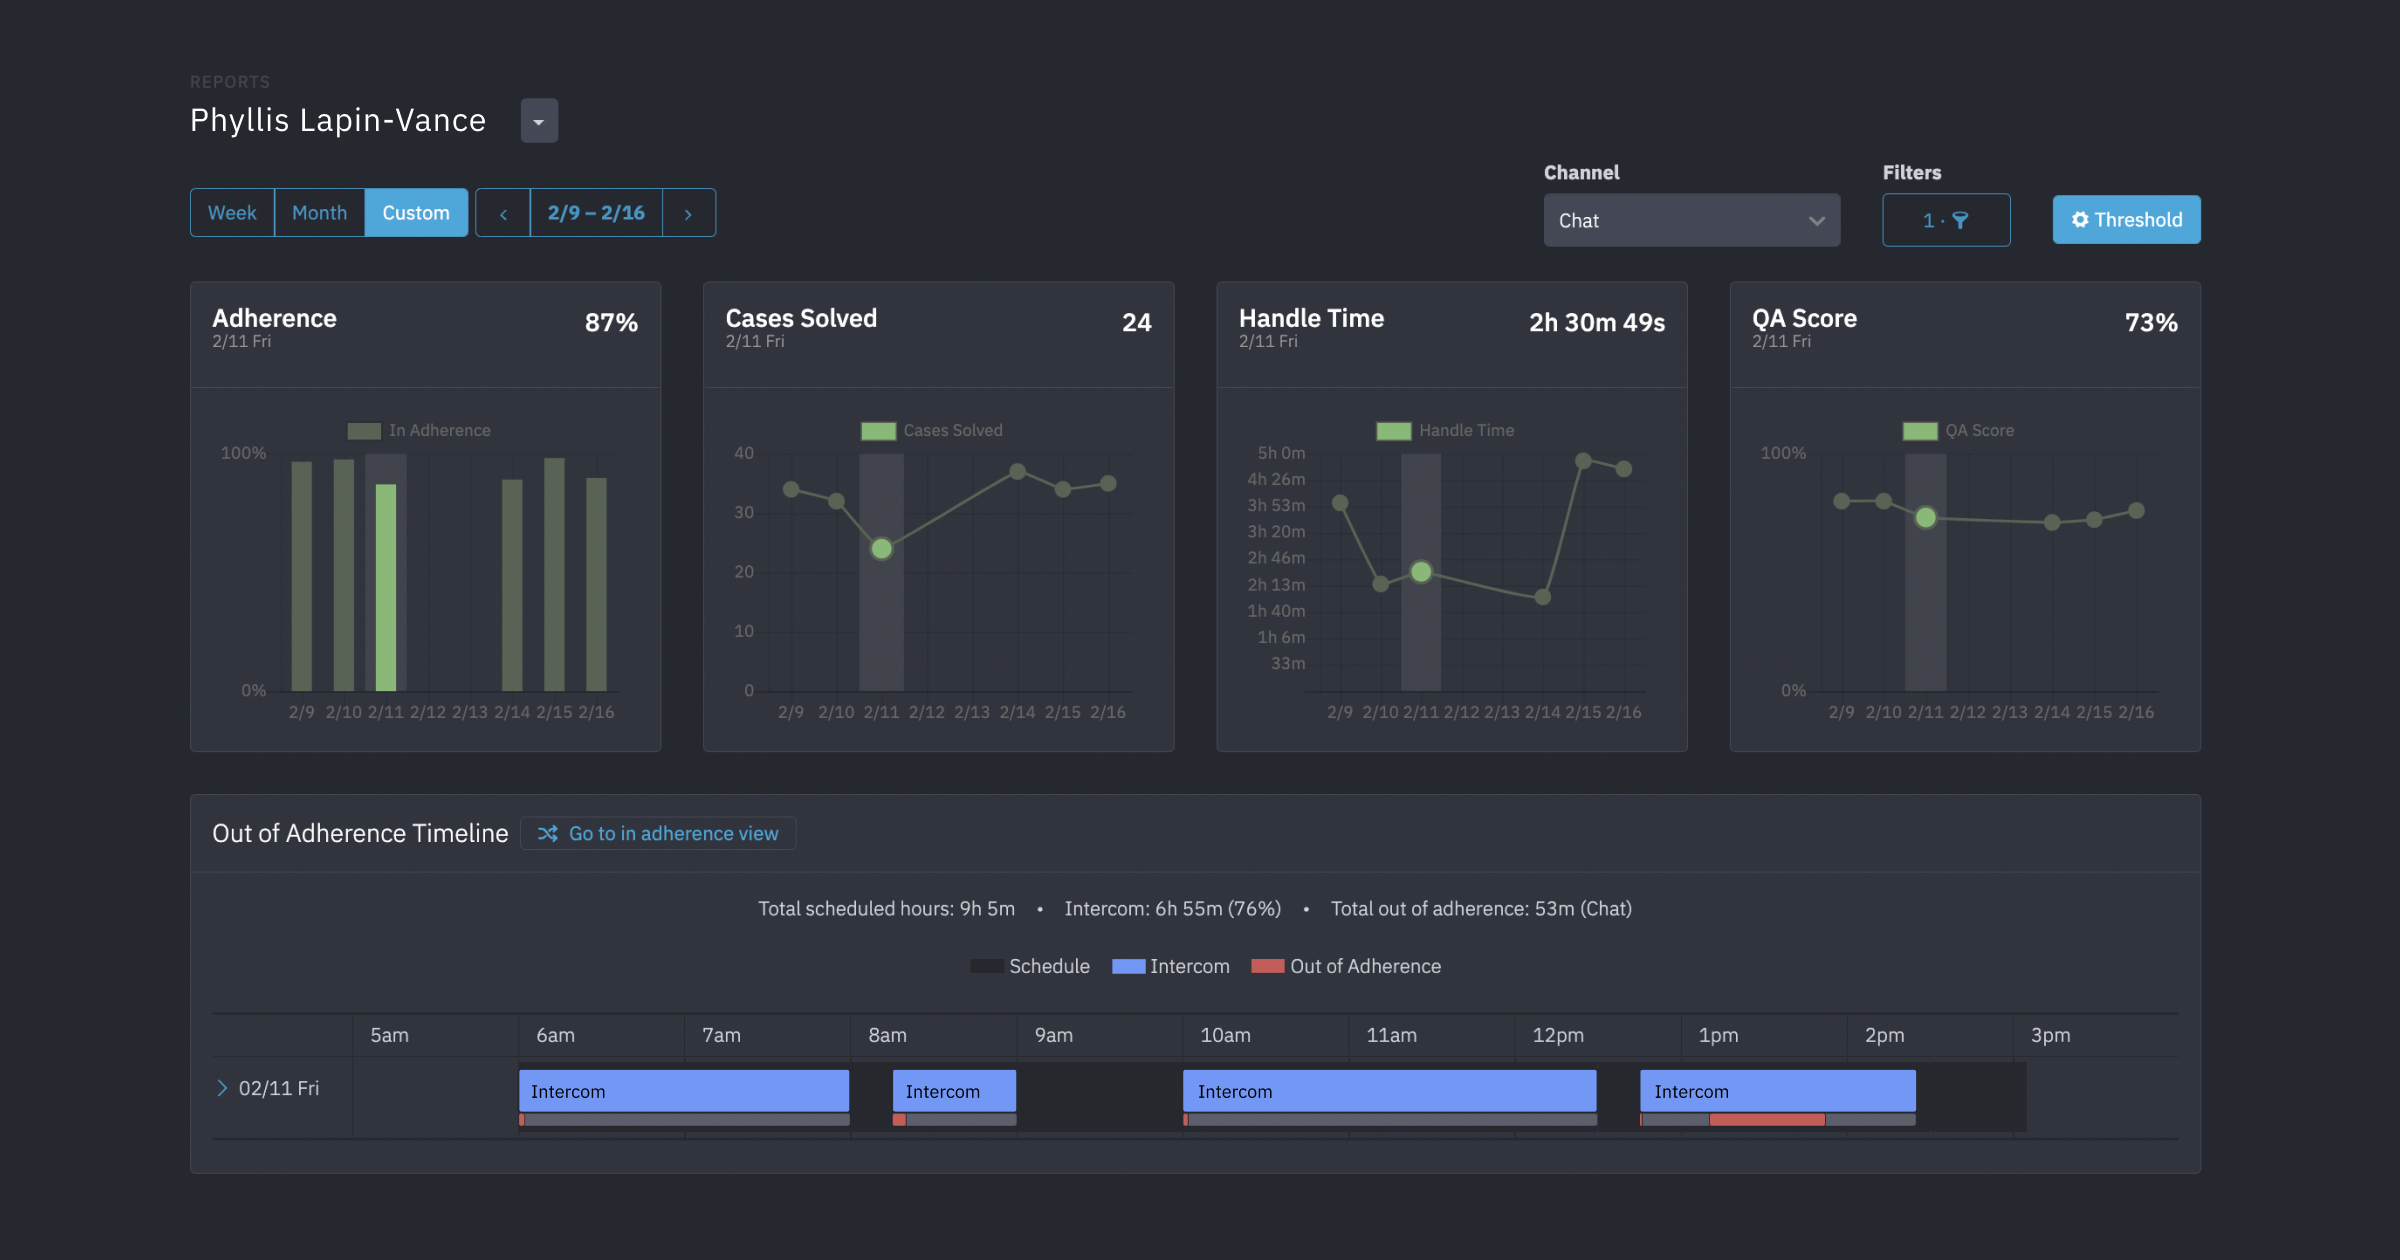
- Adherence timeline allows you to Zoom in and out on agent adherence in just a few clicks, for detailed insights on events and agents states, down to the minute.
- Threshold settings for all metrics allow you to flag when an agent’s performance isn’t meeting expectations in a specific channel or queue.
- Adjustable time frame to display all report data by week, by month, or by your chosen custom time frame
- Visibility for the entire team with options for managers to view all scorecards, agents to view their own scorecards, and for agents to view other agents’ scorecards.
Unlock agent coaching with QA
Our integration partners all have one thing in common: they all prioritize agent empowerment, which includes coaching, not punishing, agents in the pursuit of optimal performance. This is no different for MaestroQA, whose integration will power QA scores in Assembled, on the Agent Scorecard. In just a few clicks, MaestroQA users can sync their pre-defined QA scorecard and pull that score into Assembled for manager and agent visibility.
A QA process is critical in call centers, helping teams measure their performance against customer expectations. It’s especially useful for agent coaching and collecting insights to help agents hit their benchmarks. With a holistic view of each agents’ performance and team-wide thresholds for all metrics, team leaders can quickly uncover gaps and confidently coach agents with timely feedback.
Bring visibility to the entire team
When it comes to making your agents feel empowered, transparency is key. Agents who know where they stand can better prepare for conversations about performance and coaching.
By default, the Agent Scorecard is visible to managers, but managers can pass on relevant knowledge with agents by adjusting view permissions. Simply toggle your settings to let agents view their own scorecard, or, for organizations that really value transparency, give them the option to view all other agents’ scorecards.
Transparency in agent performance gets even easier with our thresholds feature. Managers can set team-wide thresholds for each of your key metrics on any channel and queue combination, so agents always know how they’re measuring up against team expectations. With total visibility, team leads and agents will always be in lockstep.
The agents are loving the transparency in Agent Scorecard. They’re in there actively being coached to that data already, so we’re excited to see the progress so far.
Clifton Farr
Workforce Operations Manager, TaskRabbit
Zoom in on adherence
There’s even more reason to get excited about the Agent Scorecard, thanks to the new Adherence Timeline, which offers up unprecedented insights into agent adherence.
Just choose any data point on your performance charts, and a timeline will automatically populate to help you easily drill down to adherence specifics, by the day, hour, and channel.
Under each event, you’ll see a green or red bar, showing you when an agent was in or out of adherence for that time period. Simply use the button at the top to toggle between an agent’s In Adherence Timeline or their Out of Adherence Timeline.
Selecting any event on the timeline will pull up a zoomed-in view, for quick access to channel-specific agent states. With insights down to the minute, you’ll have all the data you need to make sure agents are always in the right place at the right time.
At Assembled, we’re dedicated to the pursuit of building workforce management capabilities for today’s support organization, which means designing for the whole team, from managers to agents and everyone in between. The new Agent Scorecard is just one investment of many in a goal to help our customers deliver on-time, high-quality support to their customers.
📣 We love to hear from you, especially if it’s in the form of product requests. Let us know how we can keep building for your team by visiting our suggestion board.