Great support starts with having the right person in the right place at the right time. In the early days, teams often accomplish this using a mix of intuition and ad-hoc analysis, often in spreadsheets. However, as these teams grow and become more complex, a good staffing plan requires increasingly sophisticated forecasts—forecasts that take into account seasonality, organizational hierarchy, and other areas of the business, like product launches or marketing campaigns.
Forecasting was one of the first features we built at Assembled. Our initial philosophy was to build the best possible models and handle everything out of the box. As we've worked with growing teams and their increasingly complex needs, we've heard the need for visibility into and customizability over their forecasts. Today, we're excited to launch tools that give teams insight into and control over the end result of their forecasts, in addition to improvements to the underlying models.
Improvements to out-of-the-box models
Since the beginning, we've aimed to provide forecasts that achieve accuracy within 10% of actual volume out of the box. Our original models accounted for a plethora of seasonal factors, including the day of the week and the time of day, in order to trace out the arrival pattern of demand.
Our revamped models sit on top of new infrastructure that improves the stability of the platform while also allowing us to iterate more quickly from a data science perspective. The latest version of our models account for additional time-series factors, such as trends and recent momentum, that make our baseline forecasts more resilient to drastic changes in the underlying business or operation.
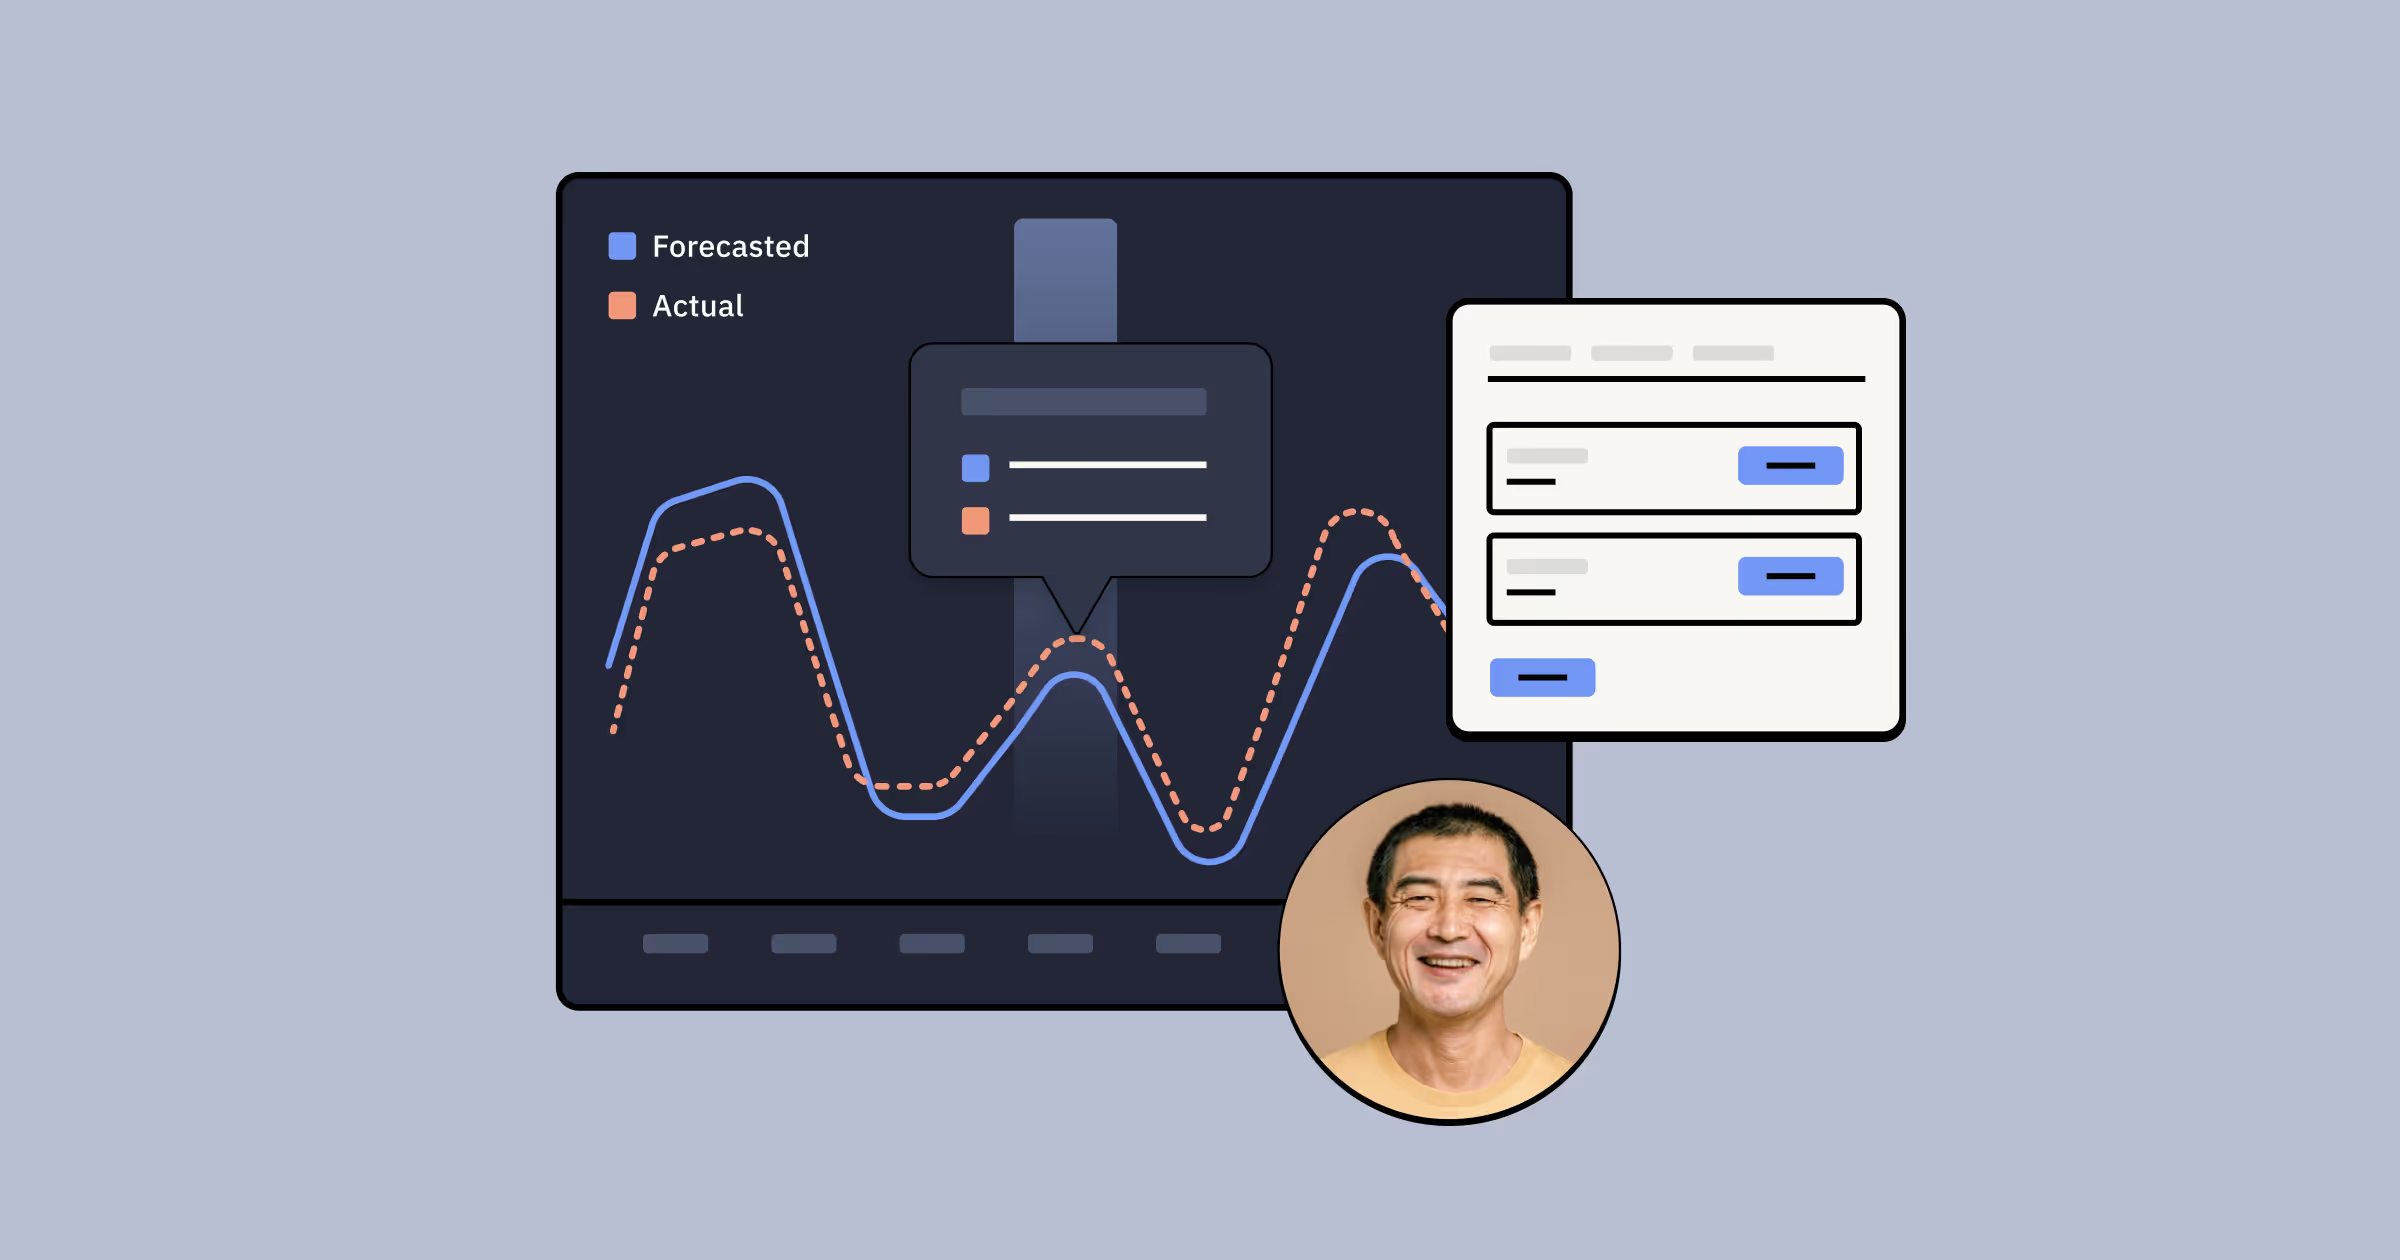
Analyze trends and accuracy over time
We've not only improved our underlying forecasts; we've also improved the interface for analyzing trends in forecasts and their accuracy over time. The new and improved Forecast Accuracy report can now be found under the top-level Forecasts section of Assembled's sidebar.
You'll find an at-a-glance report where you can quickly see the daily and weekly variance between your forecasted and actual volume, as well as the gross number of contacts received per day compared to your forecast:

For more granular reporting—including hour-by-hour data—along with service levels and other key metrics, you can still use the Forecasted vs. Actual Report.
Manually configure and customize forecasts
We've learned a lot about predicting the future over our three years forecasting volume for our users—spikes in volume can come unexpectedly; holidays don't act like a normal weekday; and other teams within the company can influence support volume through events like product launches or targeted marketing efforts. One common request we've received is for the ability to make adjustments to our forecasts.
Today, we're thrilled to introduce the ability to visualize the effect of different models as well as the ability to make manual adjustments for certain time periods. Our reloaded forecasts give you the opportunity to configure your forecast based on your own plans and goals.

While our existing models take into account a wide variety of factors, no one knows your company and your team quite like you do. If you're still forecasting for edge cases and making adjustments outside of Assembled to account for known variance events like new feature launches or outliers like outages, you can now manually change the underlying calculations on our platform to reflect your adjustments. This ensures that outlier days don't leave the team under- or overstaffed. Once it's all said and done, an adjusted forecast will look something like this:
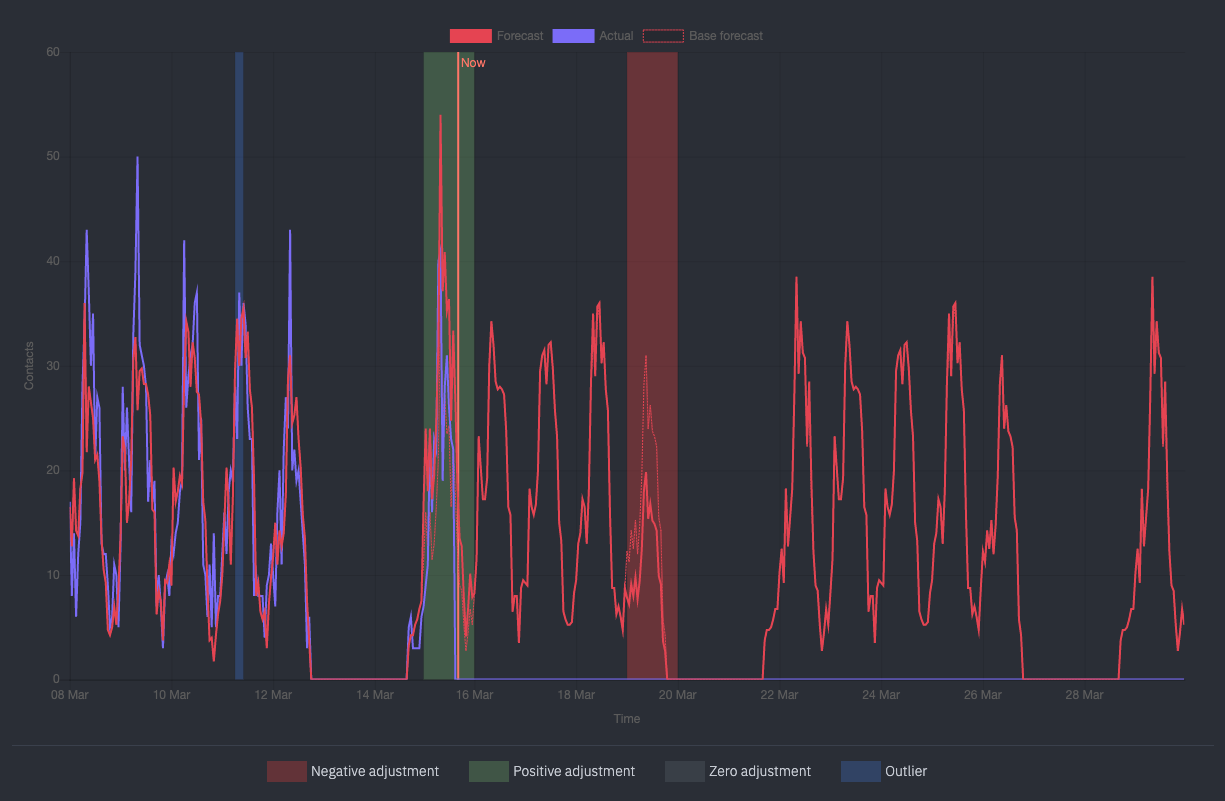
In our early testing of the feature, we've found adjustments are particularly useful for special circumstances which are known in advance like marketing efforts and holidays. Launching a product next Tuesday? Now you can adjust the baseline forecast by 30% to account for this. Outliers, on the other hand, are particularly useful for periods which should be ignored for future forecasting purposes. Did an outage last Wednesday cause a spike in support volume? Designating the affected time interval as an outlier will ensure your future forecast will ignore the inflated volume of support contacts caused by a non-normal circumstance.
—
While 100% accuracy will never be possible, we're excited to take another step closer to our goal of providing the most sophisticated models possible while also giving you the flexibility to make changes when you know they're needed.
Photo by Marco Midmore on Unsplash