While you see plenty of tweets about dreadful customer experiences, you probably find what you do incredibly rewarding. Helping people might even be why you got into support in the first place.
While you’re still committed to delivering exceptional customer experiences, things have gotten more complicated now that you’re not on the front lines. You need a more structured way to ensure customer satisfaction as your operation continues to scale.
This is where customer service metrics come into play. While metrics sometimes get a bad rap, they’re really helpful for determining how well your support team is performing and identifying opportunities for improvement.
Get ready to start on your path toward a metrics-driven support culture.
Why customer service metrics are so important
An increased focus on data has infiltrated nearly every aspect of businesses today, and support is no exception. This is great news for all of us who nerd out about numbers 🤓 but also anyone who’s tasked with making strategic decisions that impact support operations.
Tracking relevant metrics can provide you with critical insights that affect both the support team and the organization as a whole. According to Gartner, most large organizations with revenue of more than $1 billion track 50 or more customer experience metrics. This might be an extreme example if you have a support team of 20 or fewer agents, but it definitely highlights just how critical customer-focused metrics are.
Research from Accenture shows similarly positive results for businesses that are truly customer-centric. According to the report, companies that are customer-obsessed grow their profitability year-on-year by at least six times over those that are merely customer-oriented. But it’s not just about tracking metrics — you have to be able to act on them. The Accenture report makes this quite clear, revealing that leading companies are twice as likely to say they can translate customer data into actions.
Tracking customer service metrics on a regular basis can also help to inform key performance indicators (KPIs), values that track progress toward specific goals. As Intercom explains, identifying patterns or trends in metrics can help you identify whether you’re likely to meet certain objectives.
Lastly, keeping your eye on data points related to support agents and customers reveals budding issues. Maybe your support team is understaffed and could use another full-time agent. Or maybe there’s a particular area where agents could use some training to improve their performance. Armed with the right metrics, you’ll have a far easier time communicating the need for additional resources.
9 customer support metrics that matter
It’s clear that tracking customer support metrics has serious implications for your support team and the company as a whole. Keeping tabs on data related to your agents and customers can reveal whether there are opportunities to provide agent coaching and even help you identify when it’s time to hire more staff in alignment with your workforce planning strategy.
So, which metrics should you be tracking? There are almost too many to count, so you might find it helpful to think about a few larger categories that are all relevant to the customer experience. This includes those that gauge agent performance and efficiency because they tie directly into the customer experience.
Agent and team performance metrics
While professionals in nearly every industry will tell you that it’s important to focus on quality over quantity, that advice doesn’t really apply to support teams. Customers have high expectations, particularly when it comes to promptness. Let’s go over a few key metrics, their definitions, and some real-life examples of how they fit into your customer’s experience.
Abandon rate: The portion of customers who abandon the queue after waiting for a certain time period, such as 30 seconds. This rate can vary significantly depending on the time interval you choose, but it’s worth noting that Call Centre Helper shows it can rise dramatically after as little as 45 seconds. Abandon rate can also be measured as the portion of customers who abandon the queue before being answered, regardless of how long they waited.
- Example: You decide to focus on the abandon rate after 30 seconds because it aligns with your service level (more on this in a bit). If 4 out of 100 customers abandon after waiting more than 30 seconds, your abandon rate is 4%.
Adherence: The amount of time agents spend in accordance with their scheduled tasks as a proportion of their scheduled time. Adherence differs from conformance, which simply measures how much time agents spent working in proportion to their scheduled work time, in that it focuses on how closely agents are actually following the activities they’re scheduled to do.

In Assembled’s Agent Scorecard report, you can quickly get a glance at an agent’s scheduled responsibilities, the record of their actual activity from your contact platform, and whether they were in adherence.
- Example: If an agent sticks to their 100 minutes of scheduled activity for 85 minutes, their adherence is 85%.
Average handle time: The mean time spent working with a customer contact, which also includes any time spent on hold as well as after-contact work, such as taking notes and following up. This metric can be calculated both for individual agents as well as for the entire team, which can help to identify some of your most efficient team members.
- Example: If 5 of your agents usually spend 5 minutes working with customers and the other 5 agents usually spend 4 minutes working with customers, the average handle time for the team is 4 minutes and 30 seconds.
Average speed of answer: The average amount of time it takes for your team to respond to a customer, expressed as a time measurement. You can also think of it as the average amount of time a customer has to wait in queue.
- Example: Out of 100 customer contacts, 75 wait for 20 seconds and 25 wait for 30 seconds. The average speed of answer is 22.5 seconds.
Cases solved: The total number of cases — which can be via any support channel — that move from open to completed in a certain time period. This can also be expressed as an average across the entire team.
- Example: If 5 of your agents solve 15 tickets in a day and the other 5 agents solve 10, the average number of cases solved is 12.5.
First contact resolution: The portion of customer issues that are resolved fully on the initial contact, meaning no additional assistance is needed.
- Example: Out of 100 customer contacts, your team is able to resolve 70 issues during the initial contact. Your first contact resolution rate is 70%.
Service level: This customer service metric is your team’s stated service level objective. You simply need to determine whether the number of customers who were answered within your threshold was high enough to meet your intended service level.
- Example: Say your service level objective is to answer 80% of customers within 30 seconds. If you responded to 82 customers out of 100 customers in under 30 seconds, you met your service level goal.
Customer experience metrics
While there are many customer experience metrics that exist, some are very niche or more relevant to different departments. A report from Zendesk even mentions agent satisfaction as a critical metric to track in this realm, something that’s definitely critical for helping you identify whether you need to boost employee morale, but the two below are definitely ones you’ll want to start tracking if you haven’t already.
Customer satisfaction score (CSAT): The score a customer leaves in response to a follow-up survey after their contact has ended. They can be incredibly detailed, touching on different aspects of the entire support experience or they can simply be a rating on a scale of 1 to 5. You can either calculate an average CSAT or, as Qualtrics suggests, determine the total number of satisfied customers.
- Example: If you have 50 5-star ratings from customers and 50 4-star customer ratings, your average customer satisfaction score is 4.5 stars.
Net promoter score (NPS): Similar to CSAT, this score is determined by sending a simple survey to customers after the contact has ended. These are usually single-question surveys asking how likely the customer is to recommend your company to other people, often on a scale of 1 to 10 that Zendesk breaks down into these categories:
😔 0-6 = Detractors
😐 7-8 = Passives
😁 9-10 = Promoters
To calculate your NPS, subtract the percentage of detractors from the percentage of promoters and discount the passives.
- Example: If 10% of survey respondents are detractors and 80% are promoters, your NPS is 70.
How to begin using customer service metrics to your advantage
Everyone has to start somewhere with tracking metrics. You could get the ball rolling by making use of spreadsheets. It’s often the quickest way to get started, and you can customize the spreadsheet in whatever way makes the most sense for your support team.
For example, if your support team consists of those who work with customers and those who work with sellers, you would likely want to separate those agents by team to ensure you’re comparing apples to apples. The same goes for companies that have customer-facing agents as well as employee-facing agents. These vastly different audiences have very different issues, and some are probably inherently more complex.
If starting from scratch sounds a bit intimidating, you can also look for free templates that are already populated with some of the information you need. Take a look at these examples from Hootsuite and HubSpot to get a sense of what’s out there.
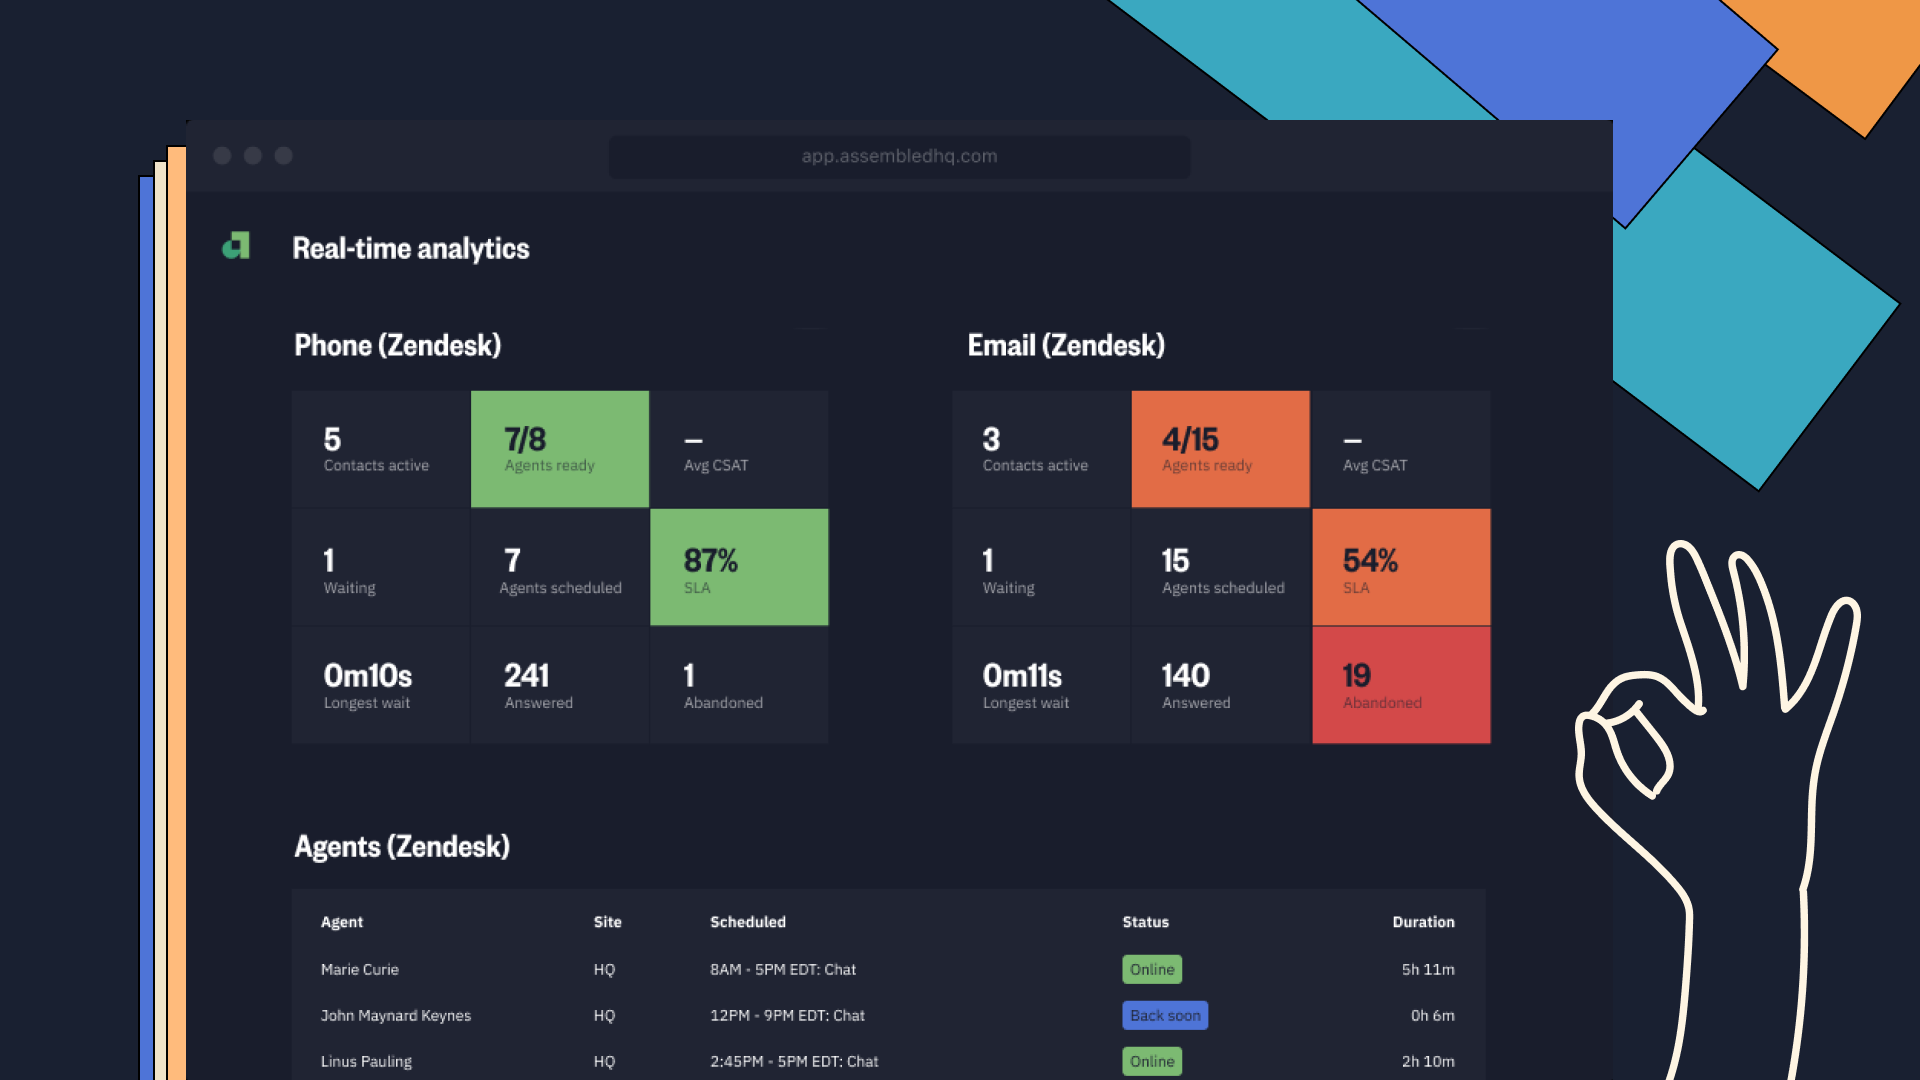
If your team is large or if it’s rapidly growing, basic tools like these might not meet your needs. In this case, it might be time to start looking into a workforce management solution. You might be interested to know that Assembled includes real-time analytics that provide visibility into individual agent activity and team performance as a whole. When customer service metrics are available without the manual work, you can more quickly identify areas of both strength and weakness.
Not only do workforce management tools allow you to easily track metrics and generate reports but they also make scheduling and forecasting far easier. That translates to efficient support managers, satisfied agents, and ultimately, happy customers.
Adopting such an advanced solution can be daunting for small teams — you’re certainly not alone if you think you’re not quite ready for workforce management. Consider a survey from Gartner on emerging service technologies, which reveals that organizations perceive workforce management software as having a low current value but a future value that’s quite high.
Whether it’s the right choice for you will depend on the current state of your support team and what you hope to achieve in the future. But if you have lofty goals, it might actually be a good move to think about workforce management sooner rather than later.
Make customer service metrics work for your support team
There’s real power in customer service metrics. You just need to track the right ones and review them consistently. Doing so makes for a more efficient, more effective support team and an overall healthier company.
And let’s not forget who benefits most of all from monitoring customer service metrics: the customers! It turns out that digging into data is one of the best ways to help people. Who would have thunk?
Remember, keeping a pulse on your support team’s health is even easier if you have the right tools. Find out how you can tie together all your data with Assembled Analytics.