What is an outlier?
Sometimes things just don’t go to plan. Even if you think you’ve got all your ducks in a row with the right people in the right place, it can take the smallest hiccup to derail your entire forecast. Which leaves you on the back foot trying to catch up.
While surprise hiccups are harder to deal with, there are ways you can spot and plan for predicted outliers, like an upcoming product launch or a scheduled site outage. We know how important it is to avoid predicted derails or, at the very least, be flexible enough to tackle them head-on.
An outlier is a one-off event or specific time block that you want to exclude from your regular forecasting model. It tends to be an unexpected event or something that doesn’t happen regularly but that can ignite a surge (or drop) in support ticket volume.
What kind of outliers can affect your forecast?
Product launches
Got an upcoming launch? A big event like this can increase support volume — how much it drives it up depends on the demand for your latest product. The good news is, that you usually know when a product launch is on the horizon (if you don’t, you’ve got a whole other set of problems to tackle first).
Site outages
Site outages can either be a surprise or a known entity depending on whether your hosting company gives you an advanced warning. But regardless, any kind of on-site issues can lead to an inflated volume of support tickets as visitors try to suss out what’s going on.
Product recalls
Product recalls aren’t great for business but they do happen — hopefully not too often. This can cause an influx of support tickets since customers are keen to understand how the recall affects them and their consumer rights.
Staff training
If a large amount of your team is training on a new process or changing the way they tackle support tickets, you might experience an inaccurate average handle time while things get ironed out. This can lead to inaccurate forecasts if the model assumes this is your new handle time.
What’s not considered an outlier
An outlier is a one-off event. A blip in the matrix, if you will. They aren’t regularly scheduled events or even individual events that happen repeatedly — like an increase in sales (and, therefore, support tickets) during certain months of the year. These are considered seasonal ebbs and flows and should be accounted for in your forecasting model based on historical data.
The low down: forecasting outliers tend to pop up when something unexpected happens. Teams often aren’t as well-trained to handle these rare events (because they’re so sporadic), which makes them more complex to handle. And, the more complex an event is, the higher the average handle time is.
Why you need to flag outliers in your forecasting model
You can’t predict the future, which means you’ll never know if an outlier is about to rear its head until it’s well and truly on top of you. While you’re tackling the problem, your forecasting model is using this fresh data to recalibrate your forecast. It’s taking the outlier and incorporating it into your forecast, assuming that this is a regular part of business.
And, if your forecast is off, your staffing plan will be too. These one-off events cause inaccurate predictions because they drive contact volume up or down. If you fail to flag these outliers they can impact your future planning, since they'll be seen as part of your regular historical data. Think about it: there’s a very small (to nil) chance that you’ll have a product recall on exactly the same day next year, or that your website will go down for the same hours it did last month.
Ready to enjoy more accurate forecasting? Get started with Assembled today.
How to use Assembled to flag outliers in your forecasting model
Our goal at Assembled has always been to provide accurate forecasts within 10% of actual volume out of the box. Our original forecasting models could account for seasonal factors right down to the time of day. Now, they go one step further by iterating quickly from a data science perspective.
The latest forecasting models account for additional time series data factors, such as trends and recent momentum, but they can also spot a spike in contact volume or handle times. This makes our baseline forecasts far more resilient to drastic changes.
Here’s how you can use Assembled to flag outliers:
Analyze trends over time
Outliers often crop up when you least expect them. But you can lessen their impact on your operations by understanding how they affect contact volume and your handle times.
Use Assembled’s Forecast Accuracy report feature to see the daily and weekly variance between your forecasted and actual volume, as well as the gross number of contacts received per day.
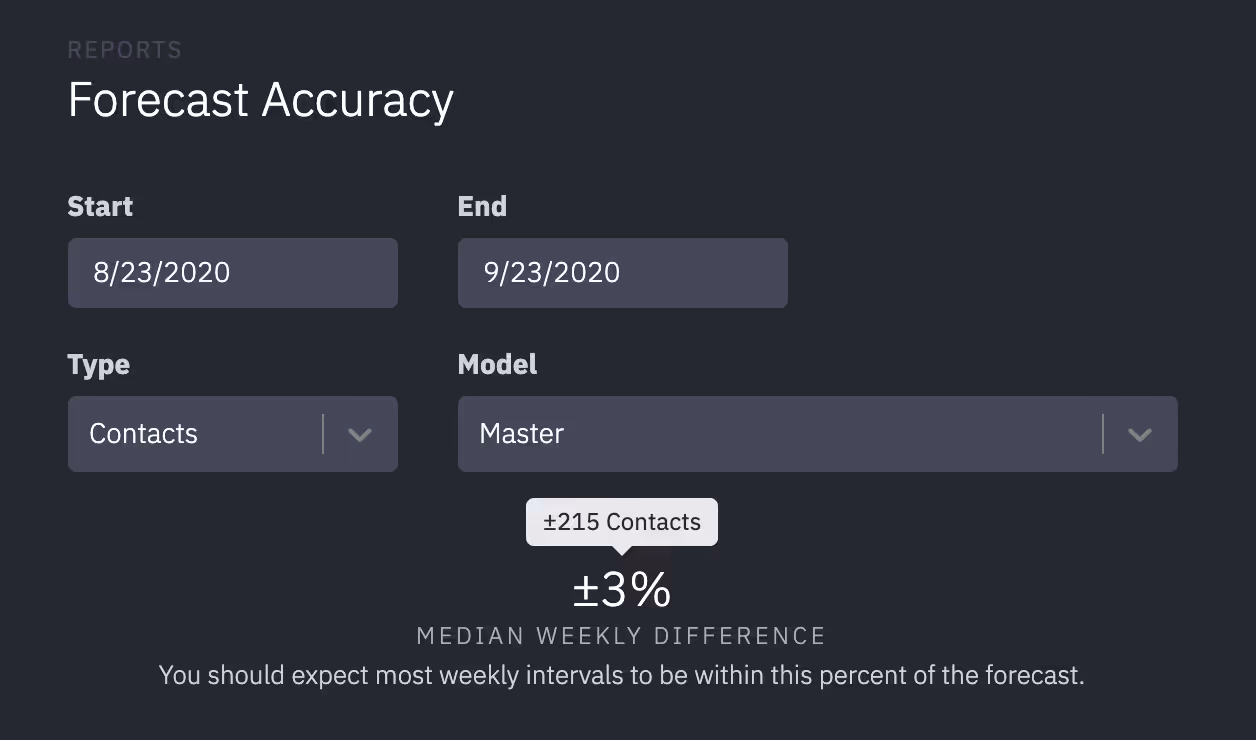
This will help you see the real-time impact of an outlier and what measures you need to put in place so it doesn’t have too much of a detrimental effect on business.
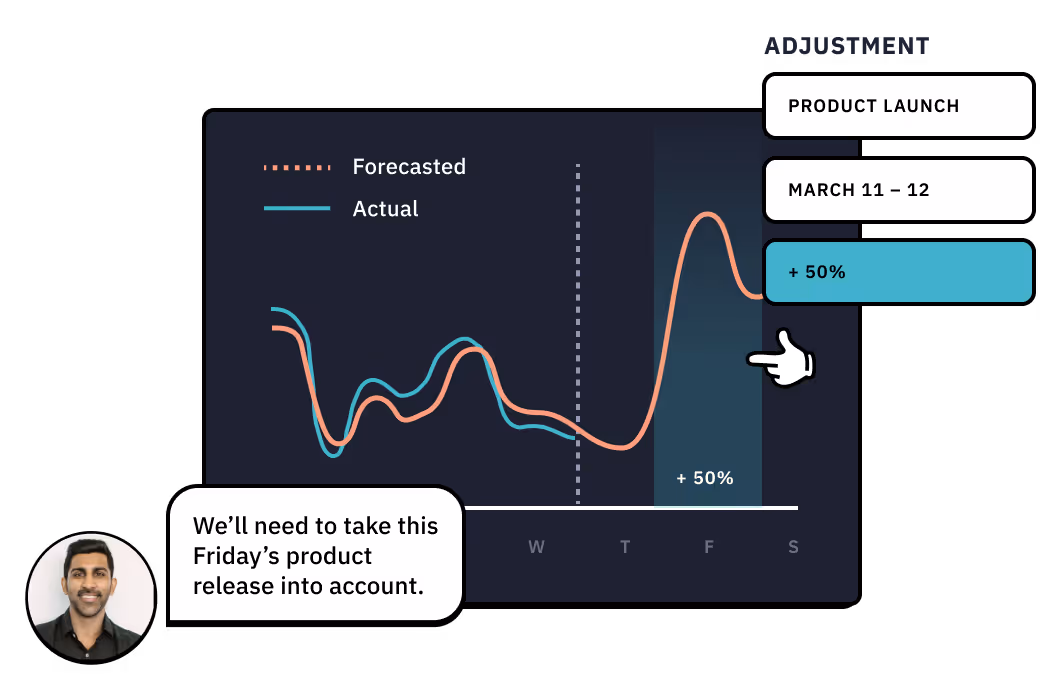
Configure and customize forecasts
Our baseline forecasts use your existing data to predict future staffing needs and support volumes. However, you can manually customize these to account for upcoming outliers or one-off events that will impact your contact volume.
This is particularly useful if you know you have staff training coming up or there’s a product launch on the horizon. Our forecasts are fully customizable so you can tweak each element to fit your unique business needs.
Adjust your forecast to account for outliers
No one knows your team or business better than you do — and you’re best positioned to report on any upcoming outliers that might affect contact volume and staffing needs. Assembled’s forecast adjustment and outlier removal feature makes it easy for you to make custom changes and adjust your forecast to account for rogue spikes.

But it’s not all down to you. Assembled automatically runs outliers and adjustments for key holidays and also suggests potential outliers so you can handle them as soon as possible.
A step-by-step guide to adjusting your forecast and removing outliers
Assembled lets you add an outlier to all queues in all channels or to a specific queue in a particular channel:
- To add adjustments to all queues: click “Add outliers”
- To add adjustments to a particular queue: select the correct channel, choose the queue, and click “Add outlier”
When you click “Add outlier”, you’ll be prompted to create an outlier card that provides Assembled with details it can use to remove the event from future forecasting.
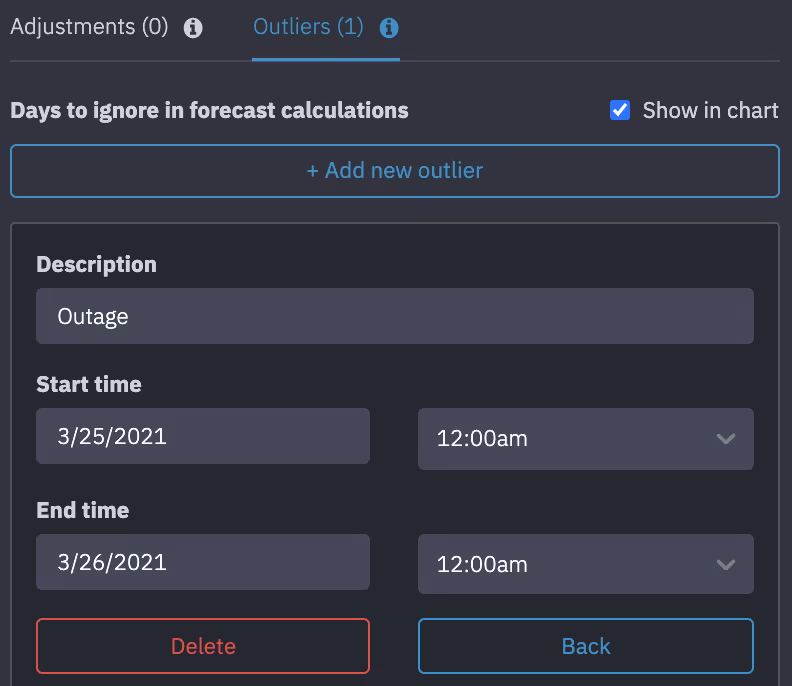
Within the card, you’ll need to add:
- A description of the event (e.g. product launch or site outage)
- The start date and start time of the outlier
- The end date and end time of this outlier (if you know it)
Once you’ve added an outlier, you can tick “Show in chart” to see the window of time you’ve removed from your forecast. You can then edit the times and dates of the outlier to aid more accurate forecasting.
Remove outliers from your forecast
Outliers can scupper your forecast if you don’t tend to them quickly. The last thing you want is excess staff or — worse — not enough based on a one-off event that happened a year ago. The thing is, outliers happen. They’re a part of business and will continue to impact your contact volume as and when they arise. However, you can ensure your forecasting model stays as accurate as possible by removing any unexpected events from your forecast.
Assembled’s adjustment and outlier removal feature makes this process a breeze. Simply input outlier information and remove the event from your forecast.
See how Assembled can create accurate forecasts that predict the number of staff you’ll need at any given time. Get started today.